Recently, ammunition consistency was brought to my attention in a rather uncouth way. I had a 2LR handgun spontaneously disassemble after a round of ammunition blew the head of its case. The case is ongoing, and I am in communication with the ammunition and gun manufacturers. I will write about it when it is all settled, and it should make an interesting read. Until then and always, be sure to wear your shooting goggles/safety glasses.
I have been collecting data in several 22LR guns with any kind of commercial ammunition, whether it is standard or high-velocity, bulk-boxed or nicely packed in plastic trays (the ammo that blew the gun up was one of the latter, loaded at supersonic velocity). The goal is to see how this variation impacts accuracy, and the results will soon make another interesting post.
Some ammunition is better in terms of consistency. In my experience (and other the load that blew the aforementioned gun), none is worse than the bulk packed Winchester Wildcat. This is not meant to disparage this ammunition, which works well for many (well, few, perhaps). It just does not meet my expectations when it comes to accuracy and reliability. It works and is decent plinking ammunition, but for me, that’s about it.
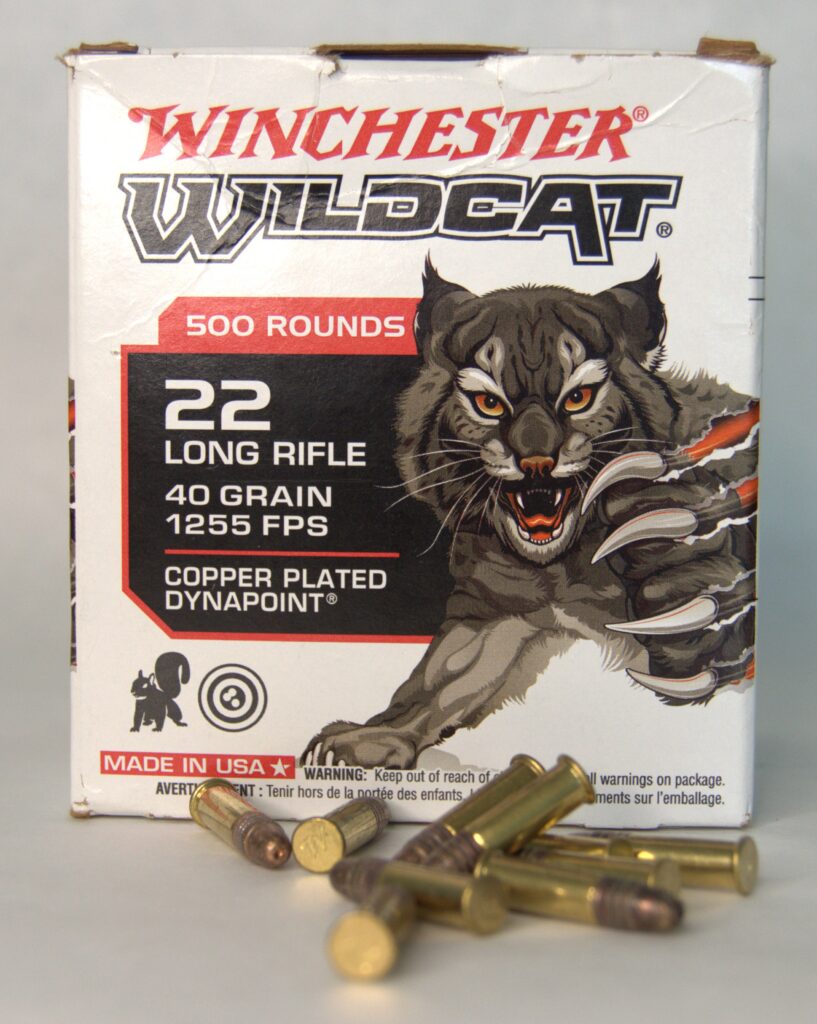
I had bought a couple of boxes during the later stages of the pandemic drought (Copper plated Dynapoint, 1,255fps). Because of its limited accuracy potential and loose tolerances, I quickly relegated this ammunition as a litmus test for reliability and function for 22LR chambered firearms. The most noticeable trait of this ammunition is the poor standard deviation and its wide velocity extreme spread.
Any significant velocity variation can be reasonably and mainly attributed to variations in powder charge and priming compound weight differences. Since bullet velocity is directly dependent on the pressure and volume of propellant gases, the faster the bullet, the higher the pressure.
Per SAAMI: “No specific recommendation is made as to proof testing Rimfire firearms designed for average service pressures at or below 26,000 psi”. Since the 22LR has a Maximum Average Pressure of 24,600 psi (SAAMI), there does not seem to be strength standards for firearms chambered in the little cartridge. Could any of these occasional anomalous velocity measurements be of concern, especially for less strong guns? Let’s nerd out and look at the numbers and see if we can find elements of answer, or, at the very least, some food for thought.
The experiment
Other than poor consistency, this ammo occasionally shows unusual velocity spikes (as well as some slow poke shots). These velocity spikes are not common but do show up every once in a while. To gauge the general consistency of the Winchester Wildcat’s velocity, I needed to have enough data points. Using some time at the range, I shot and recorded the velocity of 700 rounds, well above the accepted statistical minimum of sample size of 400. This should give me enough data to come across any unusual events.
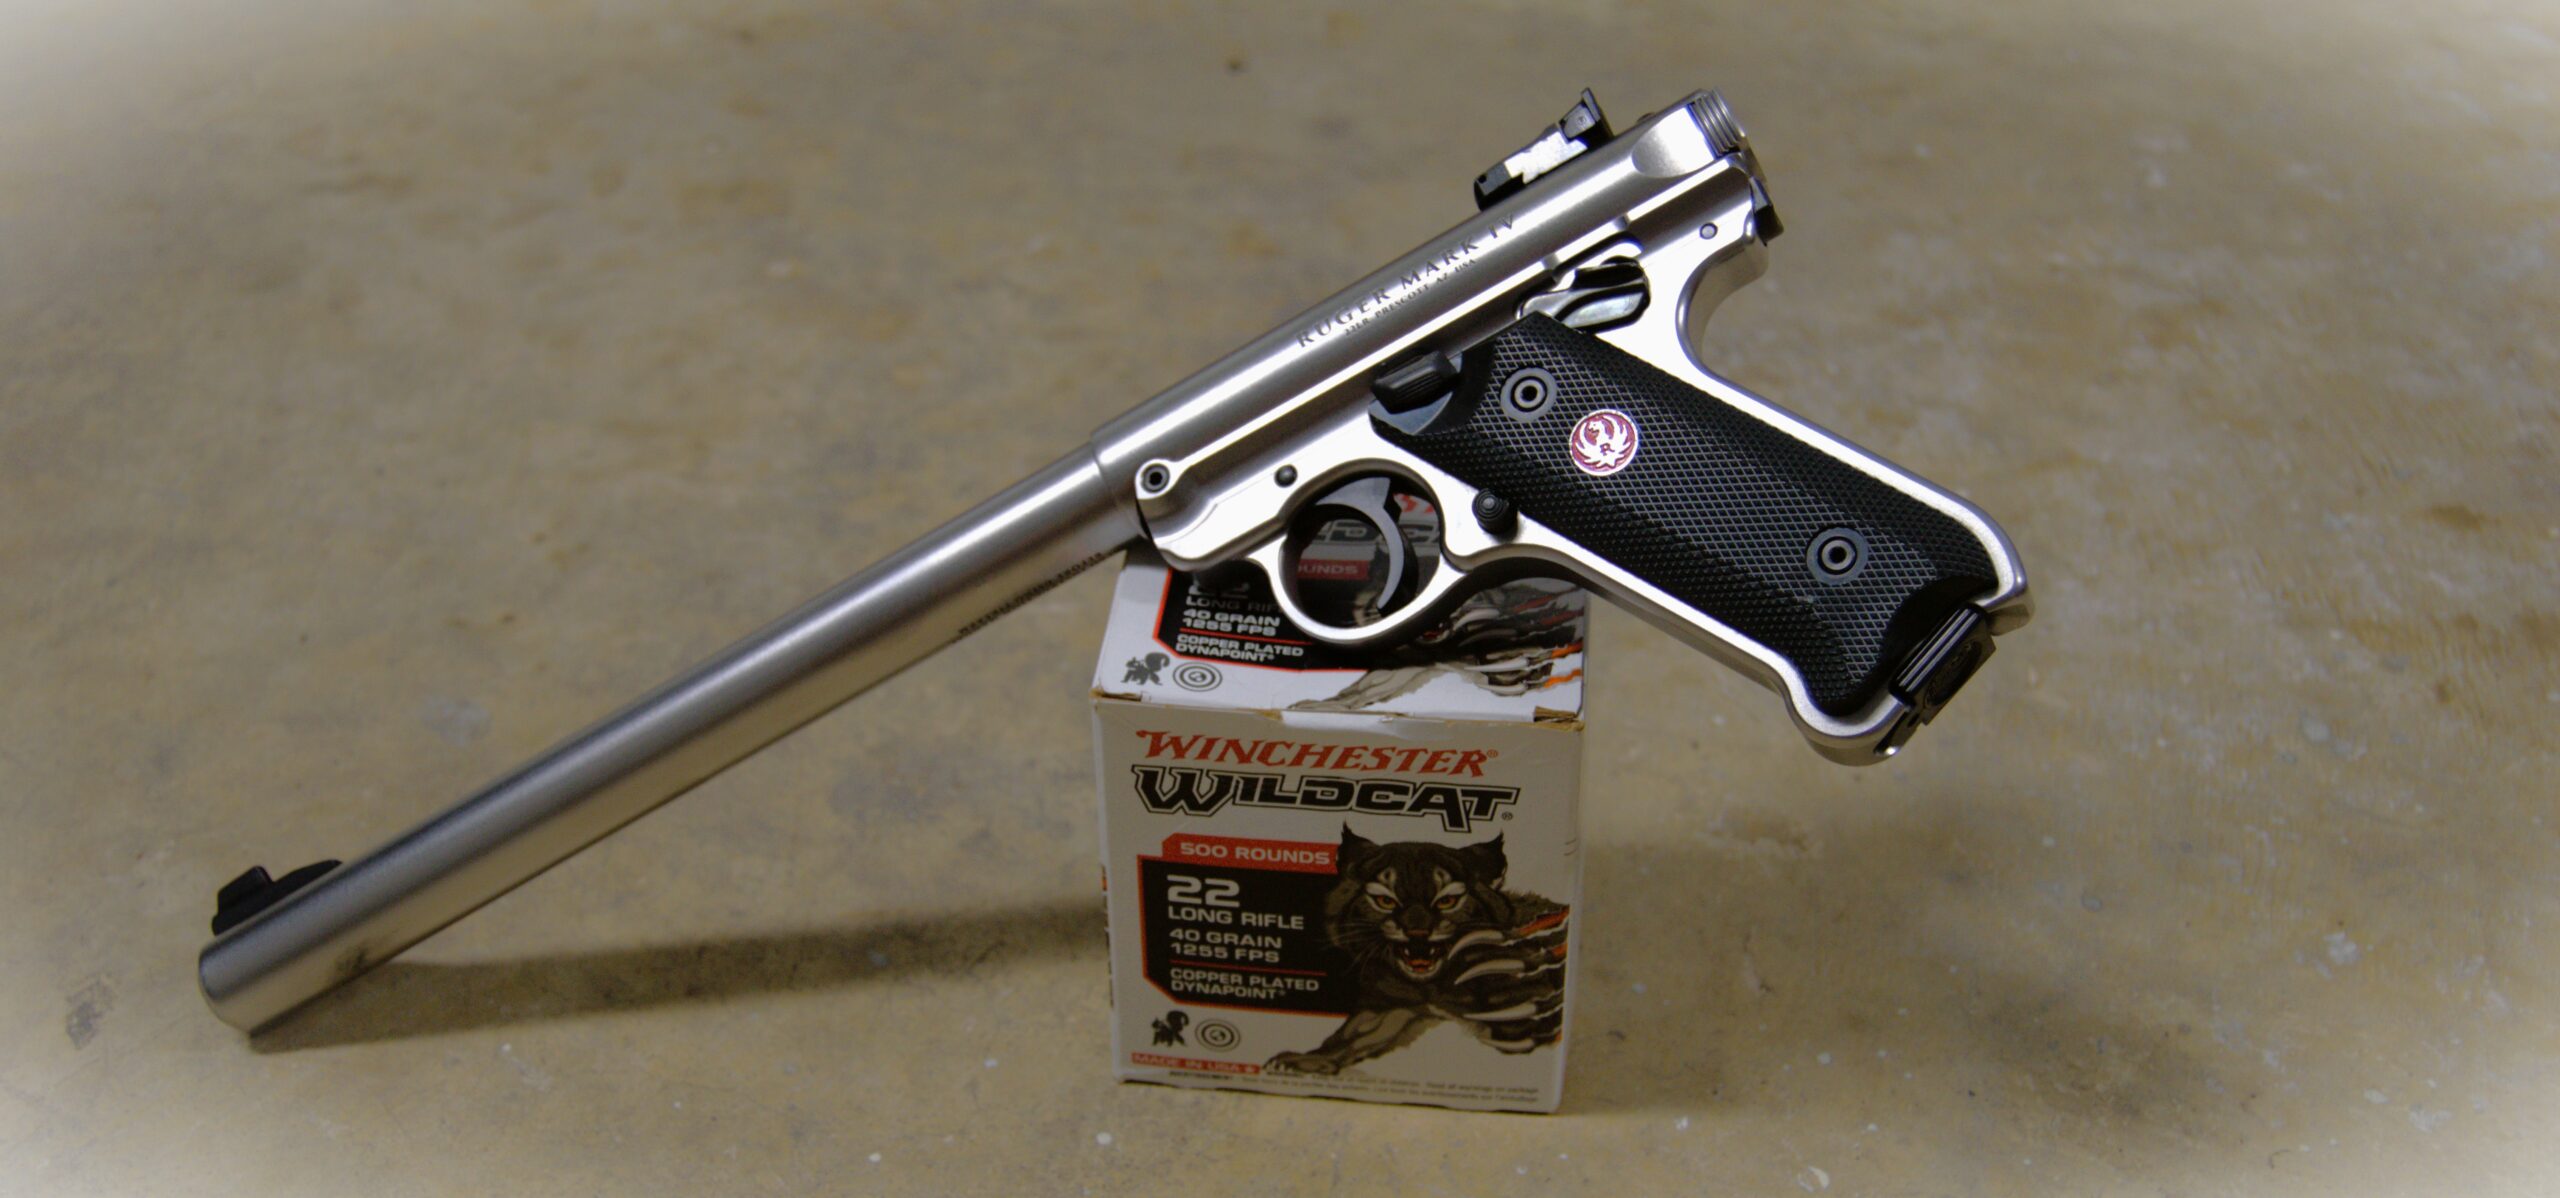
For this experiment, I enrolled my Ruger Mark IV 10’’ barrel. Not that this gun had done anything to deserve this (quite the opposite, as it is a well-behaved pistol), but because it being a Ruger, it is built like a tank, and I felt I would be safe if a case head separated.
After the last 22LR session ended in uncontrolled field stripping, I was a bit gun-shy (ha! Proper use of the expression!) shooting so-so ammunition in the hopes of finding if it presents pressures spikes. Using the full stainless-steel Ruger made me feel at peace. Furthermore, this gun shows the best velocity consistency between all the 22LR I have access to. Anything out of the ordinary in this pistol would not be a gun-induced fluke.
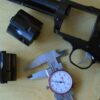
To measure speed, I used an Athlon RangeCraft Pro Velocity chronograph set 5 inches from the muzzle of the gun. The velocity measurements were then input into excel for statistical processing.
Results
The following statistics are presented in the table below. Let’s go over their significance in order.
Average velocity
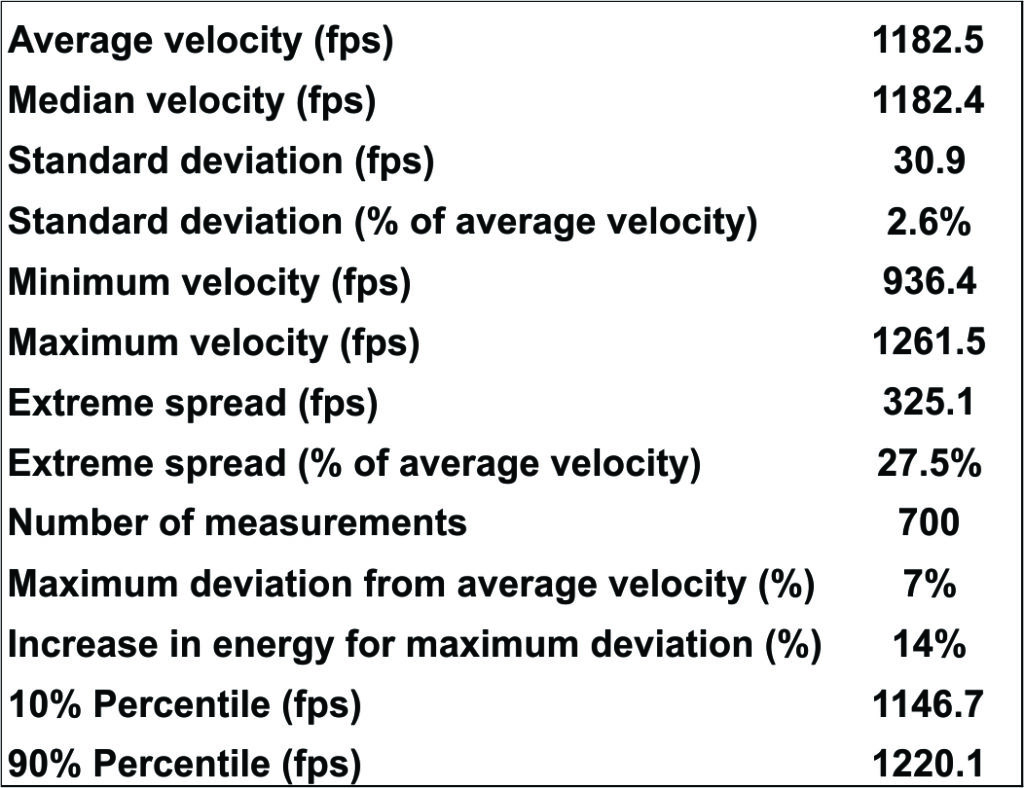
The average velocity is just that. If you sum up all the measurements and divide the result by the number of measurement, you have your average. Here, the 1182.5 fps value is below the advertised 1,255 fps, likely due to the 10’’ barrel of the gun being shorter than the factory test barrel.
Median velocity
This is the velocity below which and above which there is an equal amount of measurement. The closer it is to the average, the better. Any deviation shows that the velocity distribution is not symmetrical but skewed either below or above the average (more shot slower or faster than the average). Here the median is pretty much equal to the average with less than a tenth of a fps of difference, meaning that the velocity distribution is consistent here.
Standard deviation (absolute)
This is how much velocity difference from the average velocity you can statistically expect any shot to have. The smaller this number, the more consistent the velocity of the ammunition is. All exterior ballistics put aside, this is the most influential factor for accuracy. In terms of absolute value, this ammunition has the worst standard deviation from all the ammunition I measured in the Mark IV.
Standard deviation (relative)
This number is how much the standard deviation absolute number compares to the average velocity in percent. Here, the standard velocity represents 2.6% of the average velocity. Again, this number is the worst measurement in all the ammunition I ran in this gun. Generally speaking, this is a high number. From my experience, centerfire range pistol ammunition hovers around 1%, and rifle ammunition half that.
Minimum velocity
This is the slowest velocity measured out of 700 shots. The 936.4 fps is 79.2% of the average velocity, or, in other terms, 20.8% slower. The absolute difference is significant, with 246.1 fps.
Maximum velocity
The fastest recorded shot out of 700. The 1261.5 fps value is 7% higher than the average, or 79 fps faster.
Extreme spread (absolute)
This is the difference in velocity between the slowest and the faster shot out of 700. With a difference of 325.1 fps, this is serious. The difference in point of impact between these two shots will increase incrementally and significantly with distance.
Extreme spread (relative)
This is the velocity difference compared to the average velocity in percent. This shows how significant the extreme spread in comparison of the velocity. The value of 27.5% is uncommonly large and shows a particularly large degree of variation. Of all the ammunition tested in all the 22LR guns I shot, this is the largest relative extreme spread I came across.
Number of measurements
This is rather self-explanatory: this is how many velocity measurements were recorded and used for these statistics. Th minimum number for statistical relevance is 400. This means that any unusual or out of the ordinary event has a statistical chance of being recorded among this number. Anything higher than 400 measurements increases that chance.
Maximum deviation from average velocity
This value is the comparison of the maximum velocity to the average velocity. This is useful for the next calculation
Increase in energy for maximum deviation
This is how much relative energy is required to push the bullet to the maximum velocity recorded compared to the average velocity. By the laws of physics, in order to increase 7% from the average, the propelling energy has to increase 14%. If the average velocity represents the Maximum Average Pressure for the cartridge (SAAMI has a MAP of 24,600 psi for the 22LR), this energy increase may represent a 28,044 psi pressure (if only based on pressure).
10% percentile
Velocity below which 10% of the measurements are slower. Albeit arbitrary, this is a good indicator of the proportion of slower rounds and their distribution. Practically, this means that 10% of the shots will be below 1146.7 fps (in this gun)
90% percentile
Velocity below which 90% of the measurements are slower. As for above, this arbitrary cutoff gives a good measure of the higher velocity distribution. Ten percent of the shots will be faster than 1220.1 fps in this gun.
Analysis
Plotting the velocity from the slowest to the fastest measurement helps reveal the degree of consistency of an ammunition. The flatter the left and right (slowest and fastest) are, the smaller the extreme spread, and the flatter the central part of the curve is, the more consistent the velocity is.
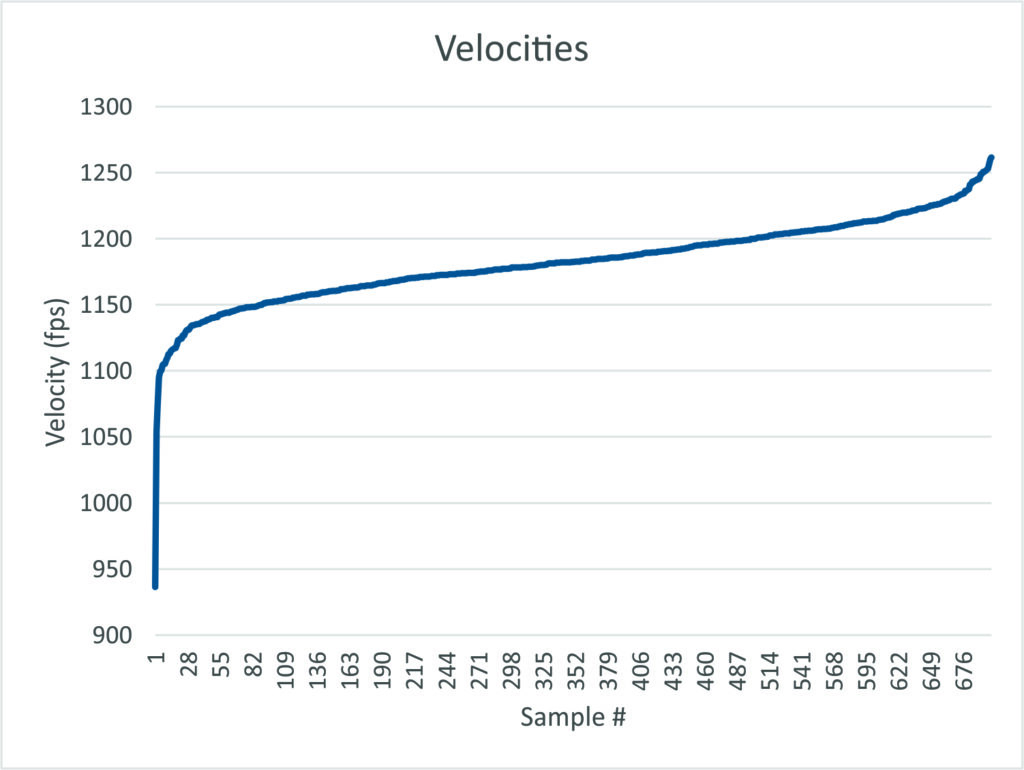
In this case, both the left of the curve and the right indicate significant and rapid excursions in velocity. The central part of the curve shows a steady and gradual increase in velocity. This shows that the Winchester Wildcat is loaded inconsistently, with widespread velocity variation and significant extreme differences.
The velocity histogram shows if some velocities are more represented than others, and the degree of variation of the velocity measurements. The narrower and more consistent the curve the better, whereas separated columns and columns at the extreme ends show clumps of velocity and extreme outliers.
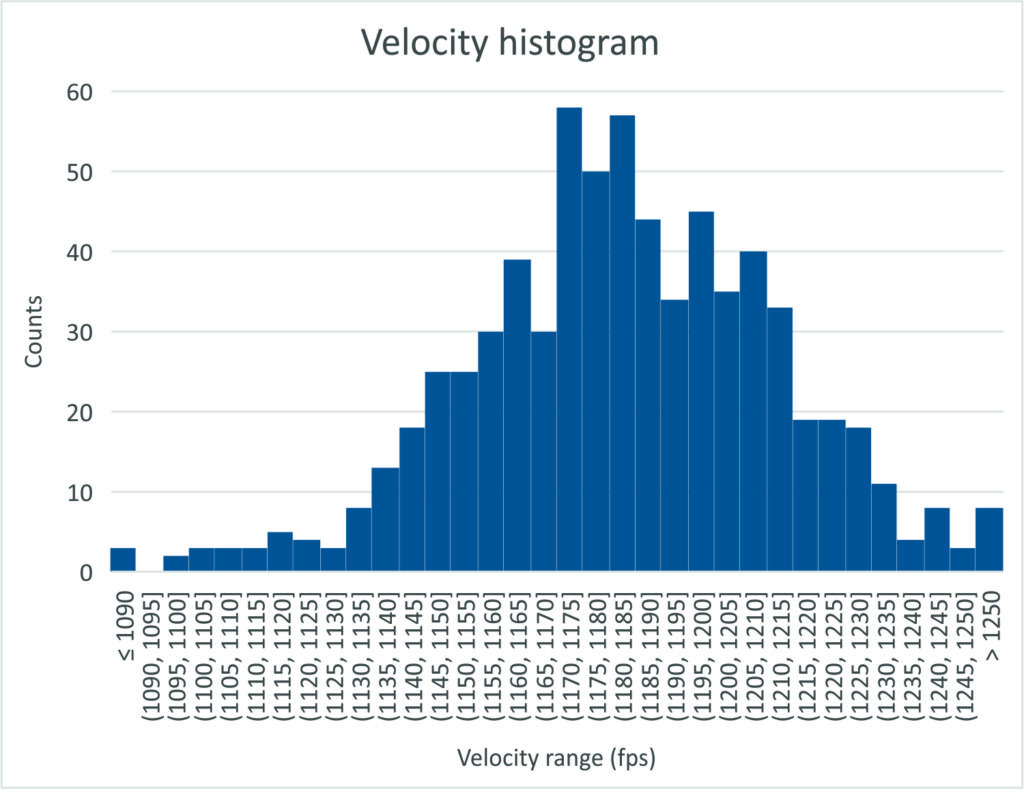
Using 5 fps bins, this histogram shows that there are several velocity “peaks” where the count is higher than above and below, likely reflecting the most frequent powder charges dispensed by the machine(s). The left and right extreme shows that 3 shots were slower than 1,090 fps and 8 were faster than 1,250 fps. This also shows that the average and median are skewed towards higher velocities.
Conclusion
The Winchester Wildcat is an adequate load for short range and casual shooting. Its wide extreme spread will limit its accuracy with distance. In the Mark IV, some of the velocities were well below the speed of sound, while other were well past the sound barrier. Velocities spanning from the subsonic and transonic zones into the supersonic realm are not conducive to good longer distance accuracy.
Furthermore, the average is rather close to the speed of sound, meaning that the bullets will quickly fall into the transonic speeds and misbehave in flight. Granted, the barrel of the Mark IV is at least 6 inches shorter than a rifle barrel: the velocities are likely to be higher in a rifle, delaying the issue or increasing the distance at which this happens. However, the general inconsistency of this ammunition will work against any gain brought by a longer barrel.
If the velocity is mainly dependent on the pressure, the highest velocities may indicate a 14% increase over the average pressure of this load. Assuming that Winchester loads for 24,600 psi on average to maximize this load’s efficiency, this may equate to 28,044 psi. This number is well below the 31,000 psi minimum pressure for the proof load and should not create issues in a modern and well-taken care gun. Despite being inconsistent, this ammunition does not seem to go over safety limits, at least in this gun and based on the aforementioned assumptions (sadly, I am not equipped with a pressure transducer unit).
However, high pressure excursions could create issues if the case has a defect like a fluke in the alloy and/or a thinned head wall. Since there are no industry strength standards for rimfire guns chambered the 22LR, it is always possible that these guns may not handle higher pressure rounds well, even if they are within the SAAMI recommendations.
At the end, this ammunition will keep being used in non-discriminant firearms for casual plinking and random testing, but I doubt I will buy it again, as I have no use for such inconsistent ammunition.